A Synergy of Tradition, Impact, and Innovation
Y + V INVEST’s investment philosophy is a unique fusion of traditional fundamental analysis, tactical use of quantitative methods and deep commitment to impact investing. This combination allows us to deliver a sophisticated, multi-dimensional investment experience.
Fundamental Analysis
Impact Investing Framework
Advanced Quant Methods
Transparent Reporting
Fundamental Analysis: The Cornerstone of Our Strategy
Traditional fundamental analysis remains at the core of our strategy. We thoroughly assess the intrinsic value of assets by examining financial indicators, industry positioning, and economic factors. This traditional approach ensures a solid foundation for our investment decisions.
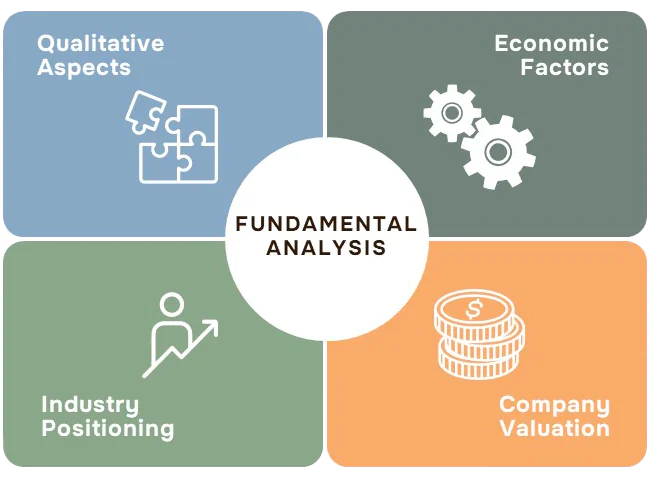
Components of Fundamental Analysis in Financial Evaluation
For deeper understanding
Trend Analysis of Price-to-Earnings Ratio Over Two Decades, Highlighting deviation from average.
In fundamental analysis, this graph can be used to gauge whether the Swiss market is overvalued or undervalued relative to other developed markets. A P/E ratio above the average suggests that investors are paying more for each unit of profit, which could imply overvaluation, whereas a P/E below the average might indicate undervaluation. We use this information to make decisions about buying or selling stocks, with the understanding that markets might revert to the mean (average P/E) over time. Additionally, the standard deviation bands help to understand the volatility and risk associated with the Swiss market compared to its peers.
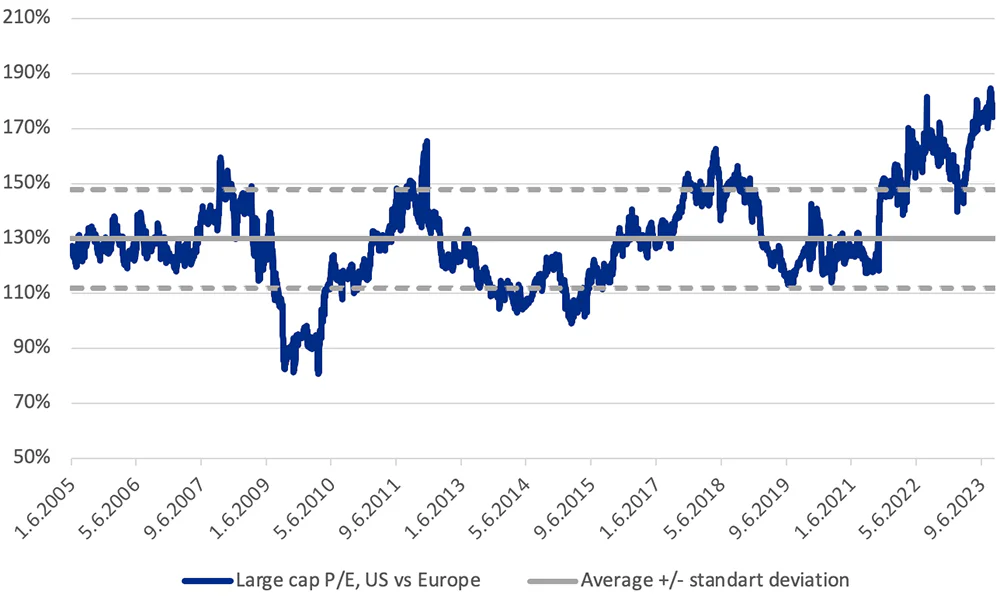
EX. 1 Remodeled graph
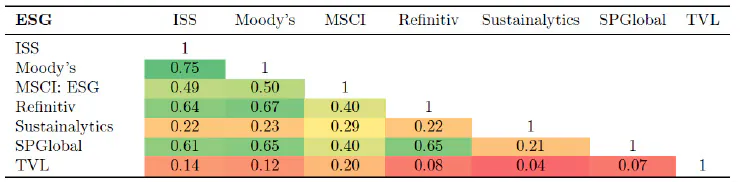
The Table shows the pairwise correlations of Environmental, Social, and Governance (ESG) raters’ scores. It compares the scores from different agencies, including ISS, Moody’s, MSCI, Refinitiv, Sustainalytics, SPGlobal, and TVL. The table is color-coded to reflect the strength of the correlation, where a score of 1 indicates a perfect positive correlation.
In the context of fundamental analysis, such correlations are crucial for understanding consistency and reliability between different ESG rating systems. The correlations presented in the table among various ESG raters show relatively moderate to low values, especially when compared to the typically higher correlations observed among credit rating agencies. These lower correlation values indicate a significant variance in how different organizations assess ESG criteria. This suggests a lack of standardization in ESG ratings, which contrasts with the more consistent methodologies used by credit rating agencies that often result in higher correlation values. The variations in ESG scoring methodologies can lead to different investment decisions and risk assessments.
Pairwise correlations of ESG raters’ scores. This table presents the pairwise correlations of all four subsamples: ESG, E, S, and G. We multiplied Sustainalytics’ scores by -1 and added 100 so that a higher value corresponds to a better ESG performance for all ratings.
Source:
ESG Confusion and Stock Returns:
Tackling the Problem of Noise, Florian Berg†, Julian F. Kölbel, Anna Pavlova, and Roberto Rigobon June 23, 2023
Impact Investing Framework: Creating Value Beyond Returns
Our commitment to impact investing is integral to our philosophy. We seek investments that not only promise financial growth but also drive positive societal and environmental change.
SDGs as a Blueprint: We align our investments with the United Nations Sustainable Development Goals, focusing on areas like sustainable cities, climate action, and quality education.
IRIS+ for Measuring Impact: We use the IRIS+ system to set clear goals, apply rigorous impact metrics, and establish tangible targets for our investments.
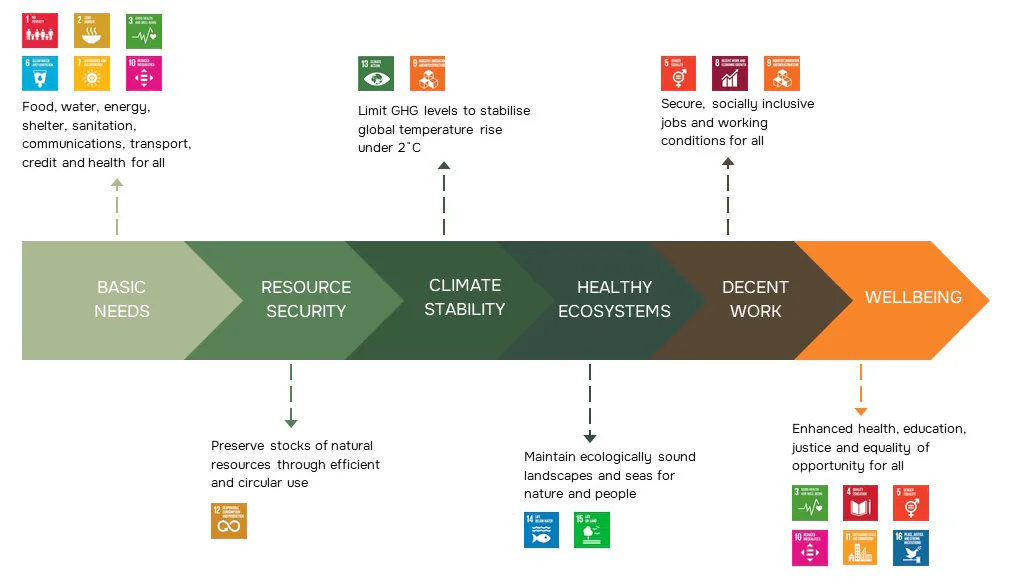
Various components of sustainability and their connection to the United Nations Sustainable Development Goals (SDGs).
For deeper understanding
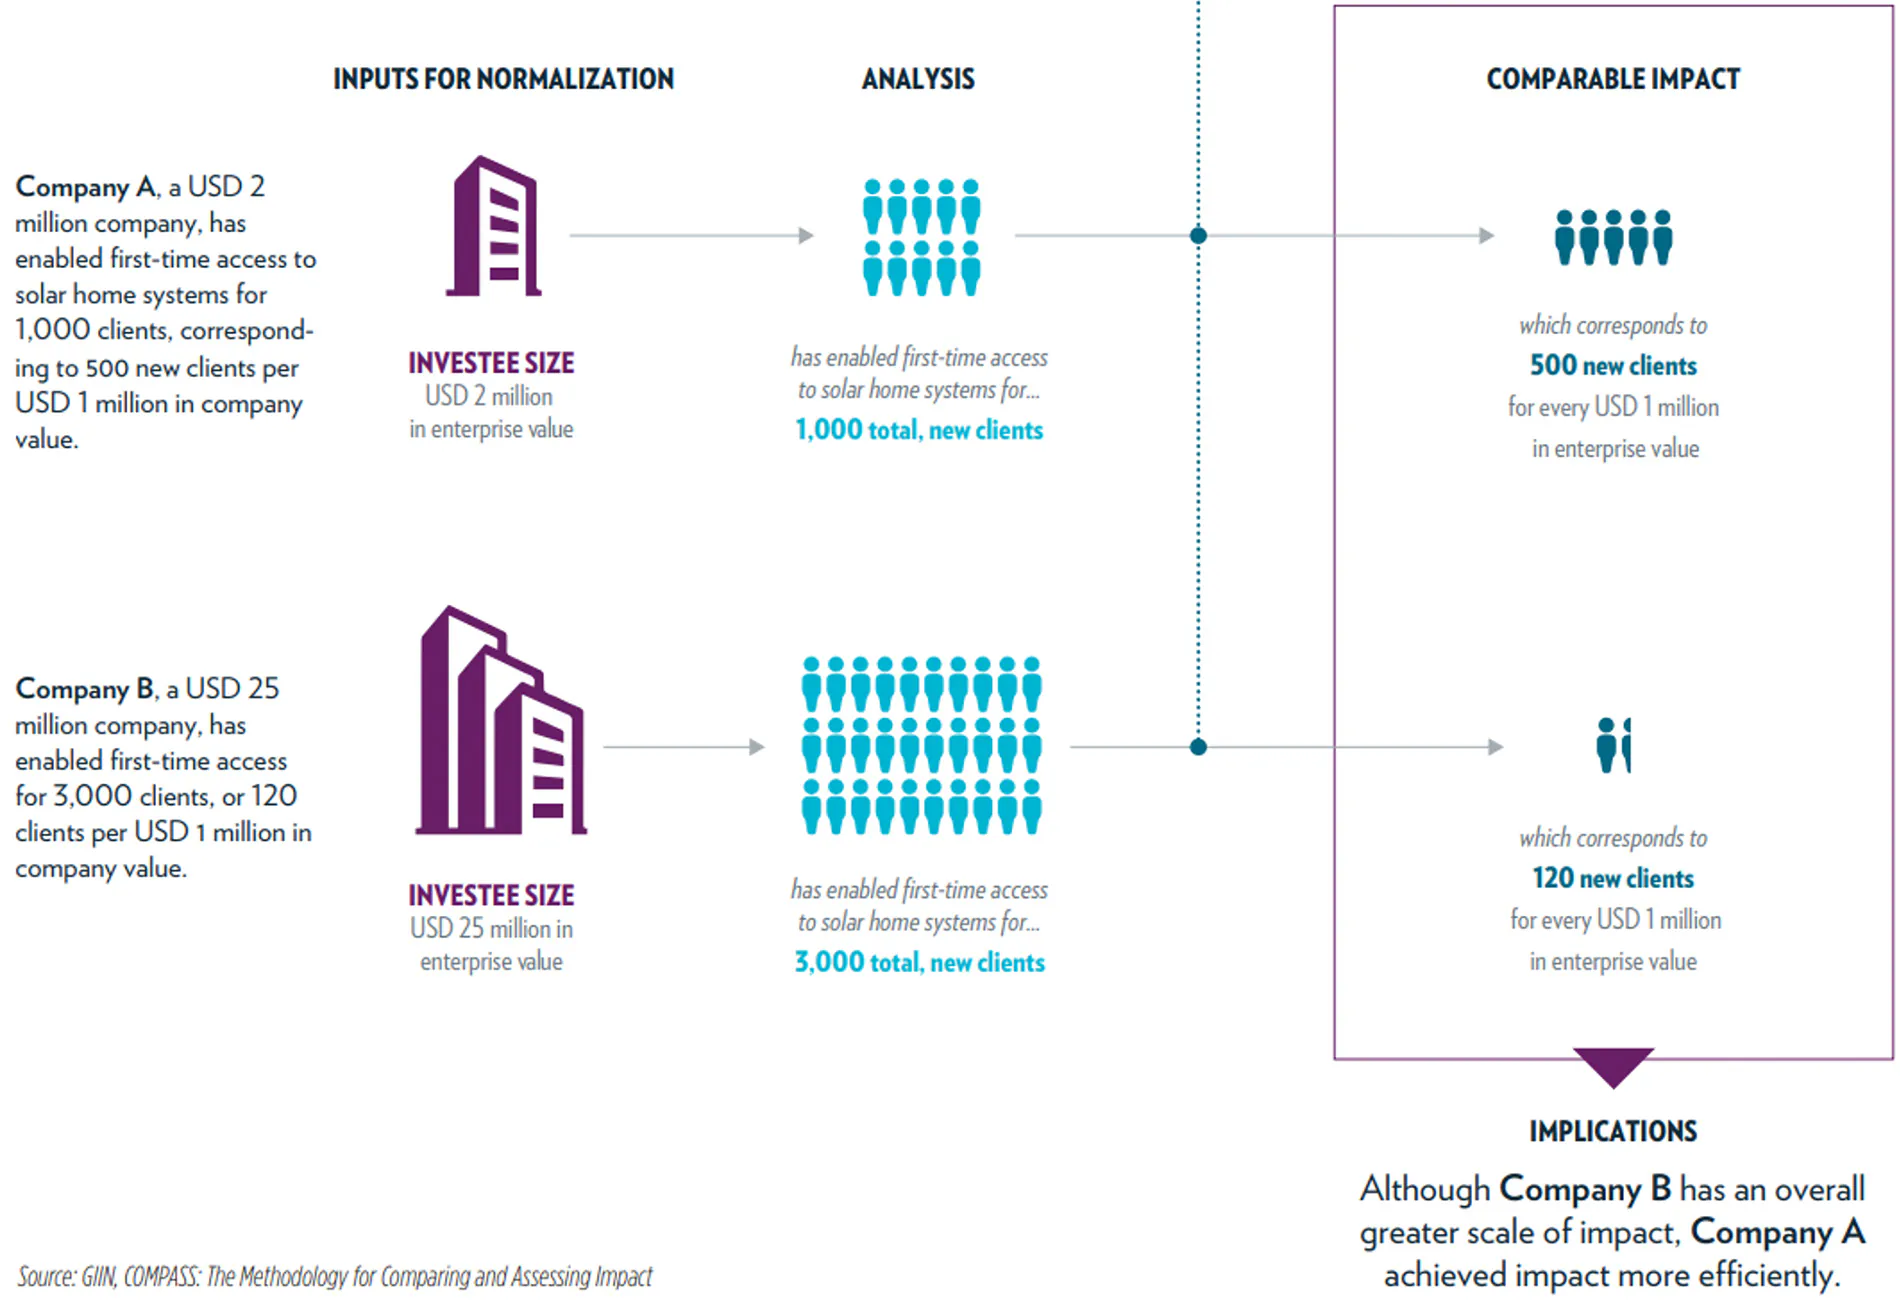
This type of analysis is useful in impact investing and assessing the effectiveness of companies in achieving social or environmental impact per dollar invested.
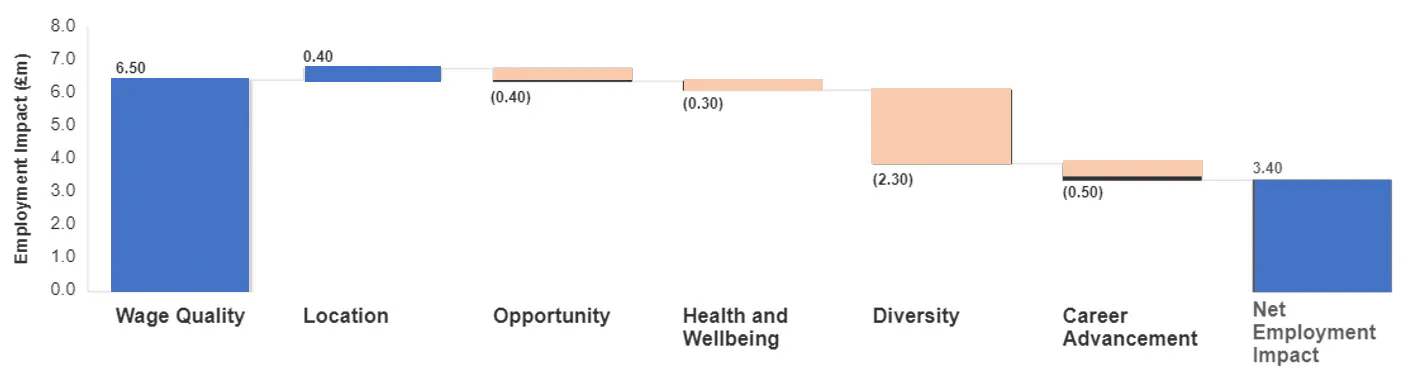
This graph could be used in evaluating a company’s Net Impact on health and wellbeing through its employment practices. Positive impacts suggest beneficial outcomes, whereas negative values point to areas that could potentially be improved for a positive effect on employees’ health and wellbeing.
Advanced Quant Methods: A Catalyst for Insights and Risk Management
During the research phase, we apply machine learning to:
- Efficiently analyse large and complex datasets.
- Enhance our understanding of market trends, industry dynamics, and company performances.
- Identify opportunities aligned with both financial performance and impact potential.
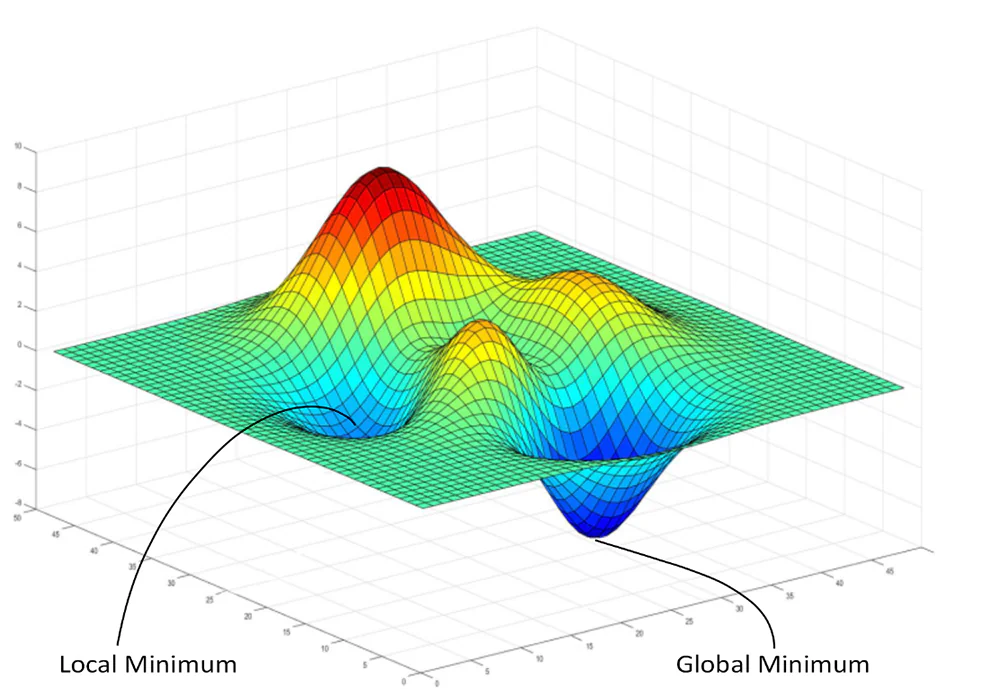
During the modelling and management phases we apply optimization techniques to construct portfolios that balance potential impact and financial returns with associated risks. This systematic approach enables us to tailor portfolios to specific risk profiles and sustainable goals.
remodeled image
For deeper understanding
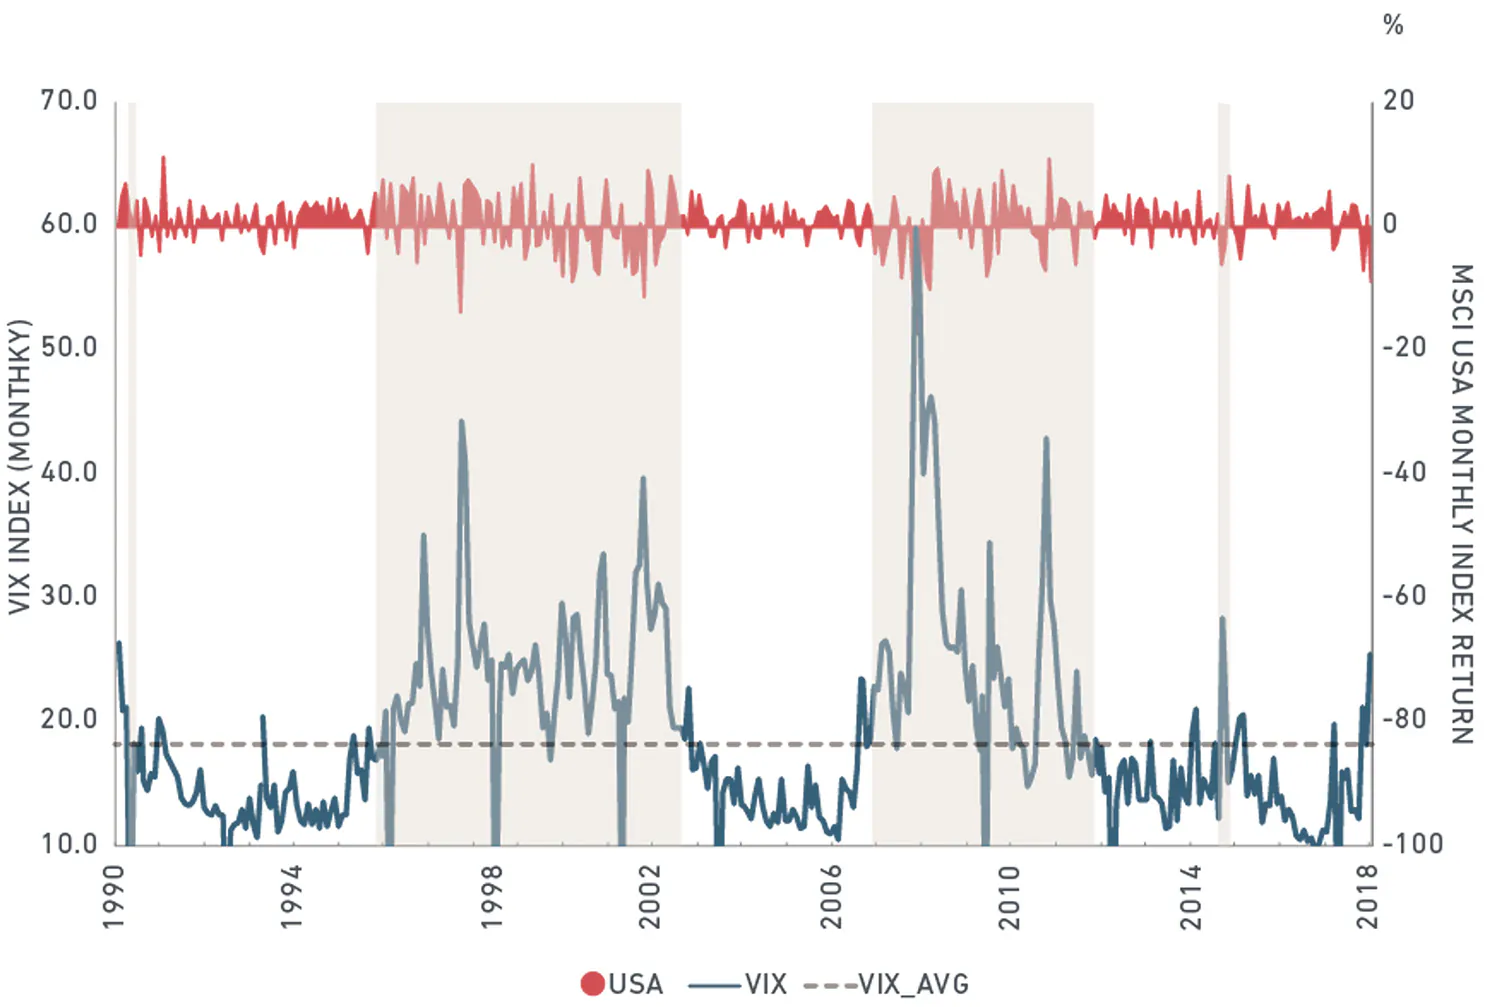
The image showcases distinct periods where the volatility, as indicated by the VIX index, is significantly higher than average, which are often referred to as “volatility regimes.” These regimes are typically characterized by increased uncertainty in the market, leading to greater fluctuations in stock prices.
Understanding and identifying these volatility regimes is crucial for investors as they may adjust their portfolios to mitigate risk during such periods. For example, they might reduce exposure to high-volatility stocks or increase their holdings in traditionally safer assets like bonds. Conversely, some investors might see these periods as opportunities to buy undervalued stocks if they believe the market will recover. Identifying past volatility regimes helps in developing models to forecast future regimes and plan investment moves in response to these periods.
EX. 1
The blue line represents the Conditional Value at Risk calculated using the Monte Carlo simulation and GARCH (Generalized Autoregressive Conditional Heteroskedasticity) models. This line provides a statistical measure of the risk associated with the investment or portfolio, estimating how much a set of investments might lose.
This comparison can be useful for risk management, as it provides a visual representation of when actual returns exceed the predicted risk thresholds, which could be an indicator of when the market conditions are not normal or when the investment is performing outside the expected range. It’s a valuable tool for financial analysts to assess and adjust their risk exposure.
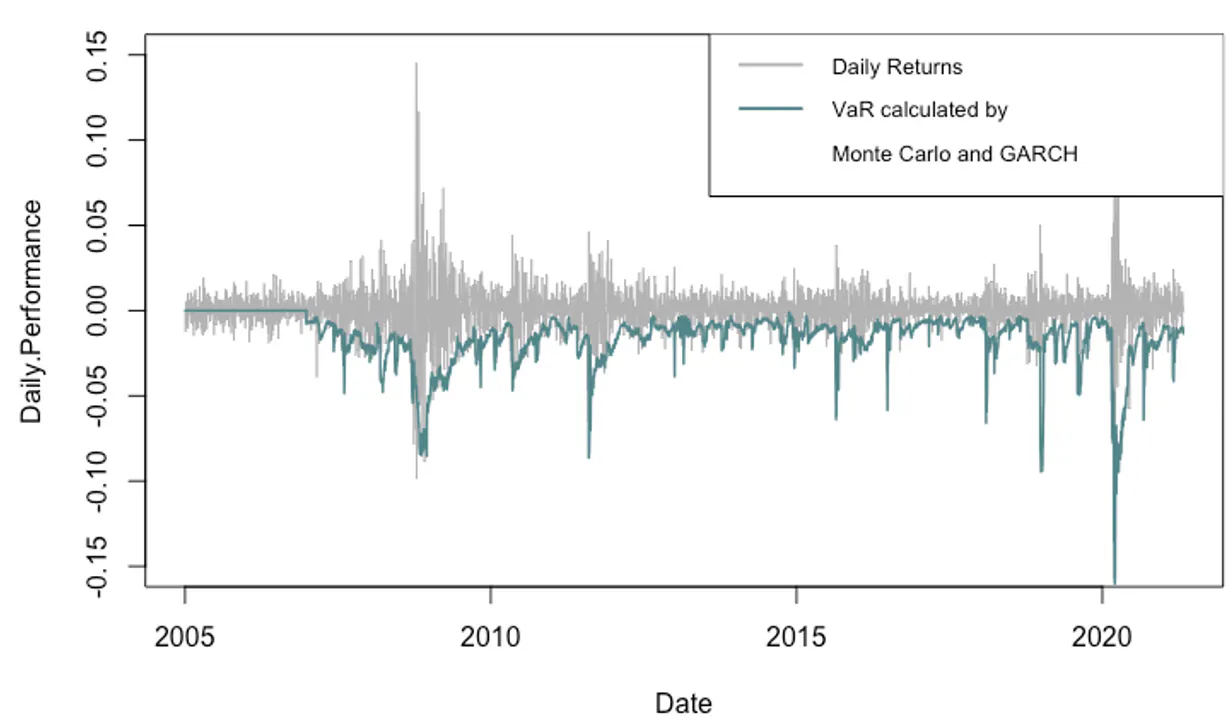
EX. 2
Transparent Reporting: Financial and Impact Metrics
Our commitment to transparency extends to both financial performance and impact measurement.
Impact Reporting Using SDGs and IRIS+: We provide detailed reports that illustrate how our investments are contributing to specific SDGs and meeting the metrics and targets defined by IRIS+.
Financial Reporting: Comprehensive financial performance reports maintain a high standard of clarity and accountability.